|
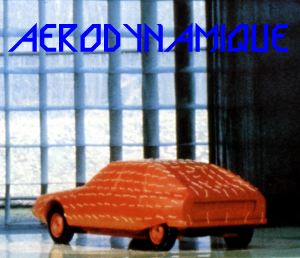
Aerodynamics
is all the rage. Many a motor manufacturer in search of fuel economy is
now discovering this science, which is also an art.
As was the case for the "traction
avant"
- or front wheel drive car, this is one of the fields in which Citroën
has been disporting for many years. Followed today by many others.
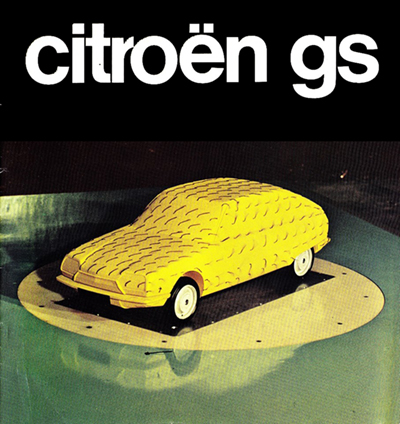
During the year 1979, the German magazine "Stern" wind
tunnel tested ten cars - and noted the GS's
aerodynamic superiority.
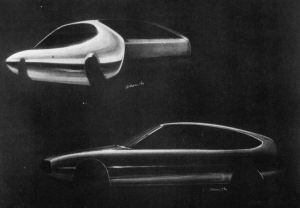
A
year later, the newspaper "Die Welt" remarked that the lines of the
"cars of the future" currently elaborated by stylists have in fact been
in existence since 1974: they are those of the Citroën CX
, the car with the apt name (the Cx of a car is its coefficient of
penetration through the air). Other observers noted that such and such
so-called experimental models, French or foreign, intended for the
years 1982-85, are still far from reaching the Cx of the standard
production Citroën GSA X3. A German Consumer Association wrote to
Citroën precisely to cast doubts on the real value of this model's CX.
The marque thereupon provided all the proofs:
The
Cx of the GSA X3, as measured at the Aerotechnical Institute at
Saint-Cyr l'Ecole, with two occupants (310 lbs) and 130 lbs of luggage
aboard, with the engine running to maintain a normal road clea-rance,
is in fact 0.318. The Consumer Association took cognisance of this and
naïvely admitted: "The specialists who advised us were of the opinion
that such a sensational value was practically unattainable". Yet it is
the best Cx in the world for a standard production car. Thanks for
recognising the fact!
All over the
World, the Cx battle rages, with penetration coefficients as its
weapons. Hardly have they been discovered when attempts are already
under way to manipulate them. It is now useful to take stock: what is
aerodynamics to-day?
1 The science of the wind
Aerodynamics
is an experimental science whose aim is the study of the relative
motions of a solid body with regard to the surrounding air. Its
application to the design of a car body constitutes one of the chief
lines of the quest for energy economy in motor vehicles.
In order to move over the ground, a body must overcome
two forces:
-
resistance
to tyre tread motion, which is dependent on the state of the surfaces
in contact and proportional to the vehicle's mass. The slower the
vehicle moves, the greater its effect.
-
resistance
to forward motion, which depends on the shape of the body and on its
frontal area. The higher the speed, the greater its effect.
All
this leads one to see in motor-car aerodynamic research a means of
reconciling economy and comfort while respecting the imperatives of
safety.
In the XVIth century, the
first, measurements of air resistance were carried out on freely
falling bodies, and it was only at the end of the XIXth century that a
new method appeared: submitting the body to be studied to an artificial
air stream. It is on this principle that wind tunnels work.
The
initial means of ventilating wind tunnels was compressed air, then the
fan, first used as a blower, and later (as is now the case) for
suction. In 1909, the well- known engineer Eiffel added two essential
devices: an intake and a diffuser. This type of wind-chamber is the
prototype of all present day tunnels.
In
applications of motor car aerodynamics, the cross section of the
experimental chamber is of the order of 15 to 20 m2 (160 to 215 sq.
ft.), i.e. 10 to 20 times the vehicle's cross-section. In the main
stream, wind speed reaches 100 mph with a stability of ±1% in
experimental time and space.
This homogeneity is fundamental, as is a low
ground-limit layer (dead fluid zone).
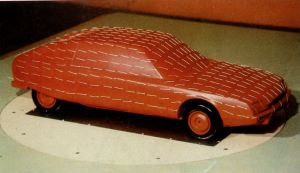
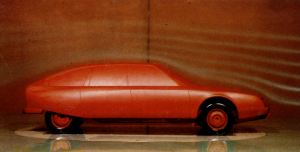
Automotive
aerodynamics also relies on reduced scale wind tunnels for use with
models, the scale usually being 1/5. These preliminary shape-research
trials, quicker and less costly than full-scale ones, eliminate gross
errors on the first prototypes.
Wind-tunnels
are fitted with relatively complex dynamometric devices allowing
measurement of all aerodynamic forces. The car-dynamometer system forms
a unit which can be turned through a certain angle relative to the
wind, thus allowing the simulation of side wind.
It
should however be borne in mind that there is no universal standard for
these measurements. Each wind tunnel itself constitutes the standard
for the experimental research done there. From one wind tunnel to
another, there may be dynamometric or blown-wind dispersions provoking
slight distortions between the results found with one or another
tunnel. For this reason, it is always well to know where and in
what circumstances the measurements put forward were made.
It
is, in particular, important to know whether the results stated were
obtained with a full-scale car, rather than with a 1/5 scale model
(whose aerodynamic results are generally about 20% better), but also
whether the car was a real one, and loaded.
All
coefficients Cx Cy Cz Cl Cm Cn are read in the wind tunnel for various
angles of side-slip ß (angle between the axis of the vehicle on test
and the axis of the wind tunnel).
Running at 80.8 mph
with a 25 mph side wind is simulated in a wind tunnel by an 84.5 mph
wind and an angle of 17 degrees between the model and the wind.
Vo = 84.5 mph (136 km/h)
Vl = 25 mph (40 km/h)
Vv = 80.8 mph (130 km/h)
ß = 17 degrees
Knowing
the distribution of weights and lifts on the front and rear axles, it
becomes possible to calculate the weight taken off the wheels at all
vehicle speeds with different side winds.
For
instance, for a standard vehicle with a total weight of 2 640 lbs (1760
lbs forward, 880 lbs rear), the weight taken off the front axles
may be 1 000 N (216 lbs) at 93.6 mph with a 50 mpg side wind, whereas a
racing car may have a weight lift equivalent to the axle load.
Using
forces and moments, it becomes easy, by simple computation, to define
the position of the centre of lateral thrust in relation to the centre
of gravity. Together with lift, this is one of the criteria of road
stability.
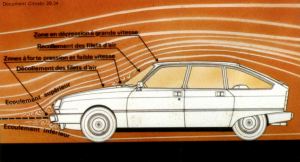
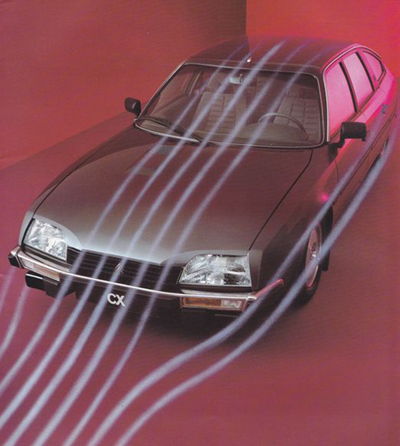
2 Visualisation of air fillets
Visualisation
of air-flow is indispensable to the comprehension and analysis of the
results founded. Two methods are in current use:
The
study of air-flow patterns makes it possible, among other things, to
look for means of compensating any aerodynamic effects which might
oppose the operation of certain components of the car. Nothing is ever
simple! Thus the (highly desirable) improvement of a vehicle's
coefficient of drag may prove detrimental to the cooling of the braking
system (highly regrettable).
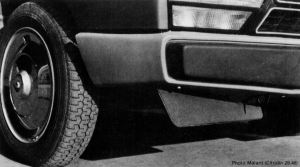
This is
why, during wind tunnel tests, the temperature of various
braking-system parts is monitored. The visualisation of air fillets
then makes it possible to design practical means of air supply to
ensure the indispensable cooling of disc brakes.
Example:
the aerodynamic study of the Citroën CX led to the setting up of an
elaborate braking system: ventilated front brakes, sheet-steel
deflectors forcing the air towards the braking system on the pivot, air
guides fixed on the under-part of the front of the body.
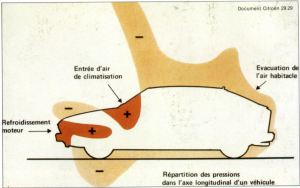
3 Pressure measurements
These measurements help to provide a partial solution to
the problems of engine cooling and passenger cabin air-conditioning.
Pressures are expressed as a non-dimensional coefficient
independent of speed:
Cp = P-Po
1/2 V2
Bernouilli's
equation : 1/2 pV2 + P = Constant along an air fillet is valid as a
first approximation for the front of the vehicle. It proves that
high-pressure areas have low air speed. Conversely, where the air
fillets cling to the body, there is a depression. (The drawing will
help you to understand this relation between air speeds and pressures
at any point).
Pressure
measurements make it possible to trace isobars (lines perpendicular to
the air fillets visualising the lines along which pressure remains
equal at a given value) on the vehicle's form.
The
choice of the position of the air inlet for passenger-cabin
air-conditioning will lie in the pressure zone at the foot of the
windscreen.
4 An air of economy
The
power that the engine must develop in order to overcome different forms
of resistance (apart from accelerations and gravity) is represented by
the formula:
W wheels = N. Wm = 1/2QCxSV3 +f. M.V.
where:
-
W wheels = power on driving wheels
-
N = transmission efficiency
-
Wm = power on engine output shaft
-
Q = air density
-
S = frontal area of car
-
Cx = coefficient of drag
-
f = frictional coefficient
-
M = vehicle mass
-
V = vehicle speed
-
1/2 CxSV3 = aerodynamic resistance
-
f.M.V. = running resistance
The
two following graphs represent respectively the formulae above, applied
to a current standard production car, and the car's consumption in
litres per 100 km according to speed. We can note the importance of
streamlining for speeds approaching and over 90 km/h /56 mph), and the
similarity between resistance and consumption curves, demonstrating the
important role played by aerodynamics in fuel saving.
|